History Archive:
Map of Europe (1000AD to today)
16 Sep 2013Pretty crazy how many changes happened in the last 1000 years, compared to the (relative) stability of recent history.
Timeline Maps
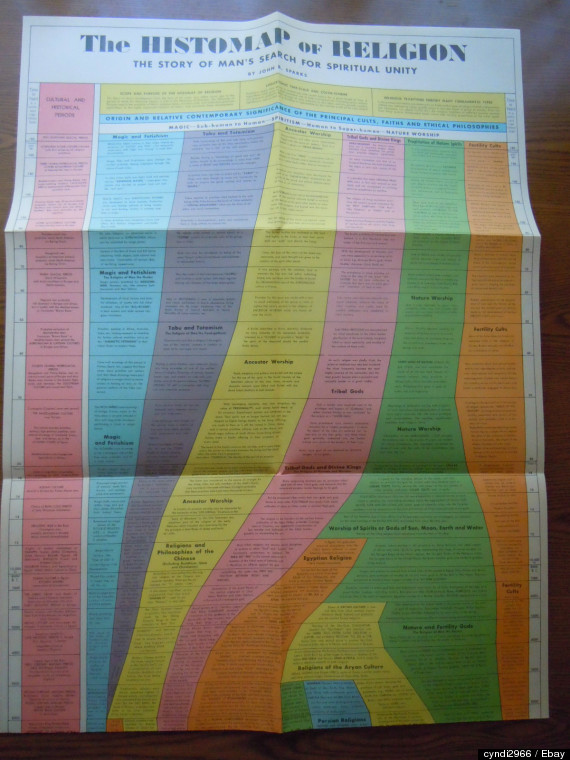
21 Aug 2013I like these vintage history maps. They are nice and information dense, and you can almost smell your old school when you look at them.


Below is the hard to find “Histomap of Religion” which recently sold online for $405.
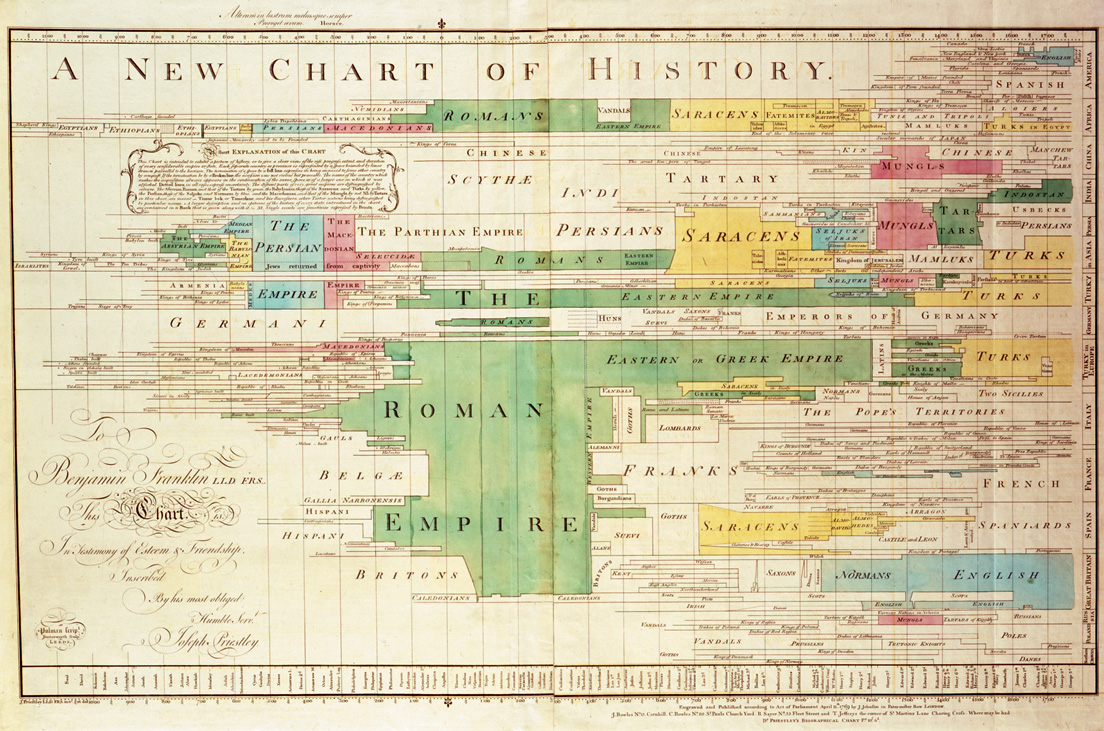
Here’s the 1881 “Synchronological Chart of Universal History” which is one of the best chart titles of all time, and stretched 23 feet long.

![]()
Mapping Vice in San Francisco
15 Aug 2013Ok, it’s from 1885, but have things really changed much?

What Lands Did Europeans Really Discover?
14 Aug 2013Nice work by Bill Rankin over at Radial Cartography. He tries to map out lands that were really uninhabited prior to discovery. You’ll notice they were mostly small islands.

If you like maps and haven’t browsed that site before, you should. Lots of cool projects:
A table of projections:

Comparison of subways in the USA:

Make a personalized celestial calendar:

Washington DC Transit (1888-today)
13 Aug 2013I came across this interesting map of 1888 horsedrawn streetcars in Washington DC:

Not entirely difference from the location accurate version of the modern subway map:

Of course, a more accurate comparison is probably to a modern bus map. but they are so busy:

DC is scheduled to re-introduce streetcars in 2013/14, starting with a small run along H Street SE.
How Old are the Buildings in Brooklyn?
In: History Interactive Maps
5 Aug 2013An absurdly detailed map of Brooklyn color-coded by the age of the buildings.

Meteorite Sightings (1913-2013)
26 Jul 2013Meteorite fireballs witnessed from 1913. I’m not sure what is gained by putting this on a map. Also, since this is just eyewitness accounts, it suffers from population density bias.

Evolution of Video Game Controllers
In: History Internet/tech
25 Jun 2013A trip down time-wasting memory lane.


History of Spying (on ourselves; 1791-2013)
11 Jun 2013A wonderful interactive timeline of legislation, rulings, and events related to domestic surveillance in the United States. You can drill down into each event for an explanation, and links to primary sources (like the full text of legislation, etc).

Things have changed quite a bit, but is anyone (including the children) happier or better off?

31 Charts to Restore Your Faith in Humanity
31 May 2013A lot of these are misleading – but hey, so are most charts. For more entertaining interpretations of the same figures, check out The Washington Post’s “31 Charts to Destroy Your Faith in Humanity.”


 and so on.
United States Immigration
30 May 2013Immigration has always been a tough issue to deal with.

The chart reminds me of this John Stewart bit on immigration and “Traditional America”:
2000 years of Global Temperatures
15 May 2013Interesting scientific work, building on prior studies from across the world. Rather than get into the findings in detail I refer you to the NYT article and a very detail FAQ at the authors’ website)

Satellite GIFs
15 May 2013It’s interesting how popular animated gifs have become again. I guess that even with high speed internet people are a little fed up with player load times and lags. Here GIFs are used to show time lapse satellite images of mankind’s impact on the earth. (google earth link)


Airline Prices (1979-2011)
13 Mar 2013The effects of deregulation of the airline industry in the late 70s – from an article by the always insightful Steven Pearlstein.

Somewhat ironically, the original expansion of competition that deregulation was supposed to create has now entirely disappeared (the below could be updated to show the recent USAir/American merger).


What is Chart Porn?
An addictive collection of beautiful charts, graphs, maps, and interactive data visualization toys -- on topics from around the world.
Categories
- Bailout (118)
- Chartporn Related (3)
- Commentary (21)
- Culture (669)
- Emerging Markets (66)
- Employment (245)
- Environment/weather (133)
- Finance (298)
- Food (92)
- Global Economy (373)
- Graphic Design (bad) (26)
- Graphic Design (general) (183)
- Graphic Tools (23)
- History (158)
- Housing (162)
- Humor (204)
- Innovative (183)
- Interactive (545)
- Internet/tech (97)
- Maps (578)
- News Media (34)
- Politics (329)
- Reference (97)
- Science (331)
- Source: Economist (101)
- Source: FT (92)
- Source: NYT (147)
- Source: Ritholtz (76)
- Source: USA Today (27)
- Source: Washington Post (90)
- Source: WSJ (135)
- Sports (58)
- Stock Market (74)
- Uncategorized (2)
- Updated regularly (76)
- US Economy (553)
- Video (22)
- Aram Korevaar: This chart is now being used as a projection in which countries such as China see themselves as in a [...]
- David: Welcome back Chart Porn! [...]
- J S: Thanks for the great story. Miss reading this blog. Hope to see you more active again. [...]
- jake: I lived in a DC row house for 6 years, and I'm writing this comment from my tiny 1 bedroom apartment [...]
- ronny pettersen: Hilarious and unfortunately accurate... ;-) [...]