TikTok’s search evolution
In: Internet/tech
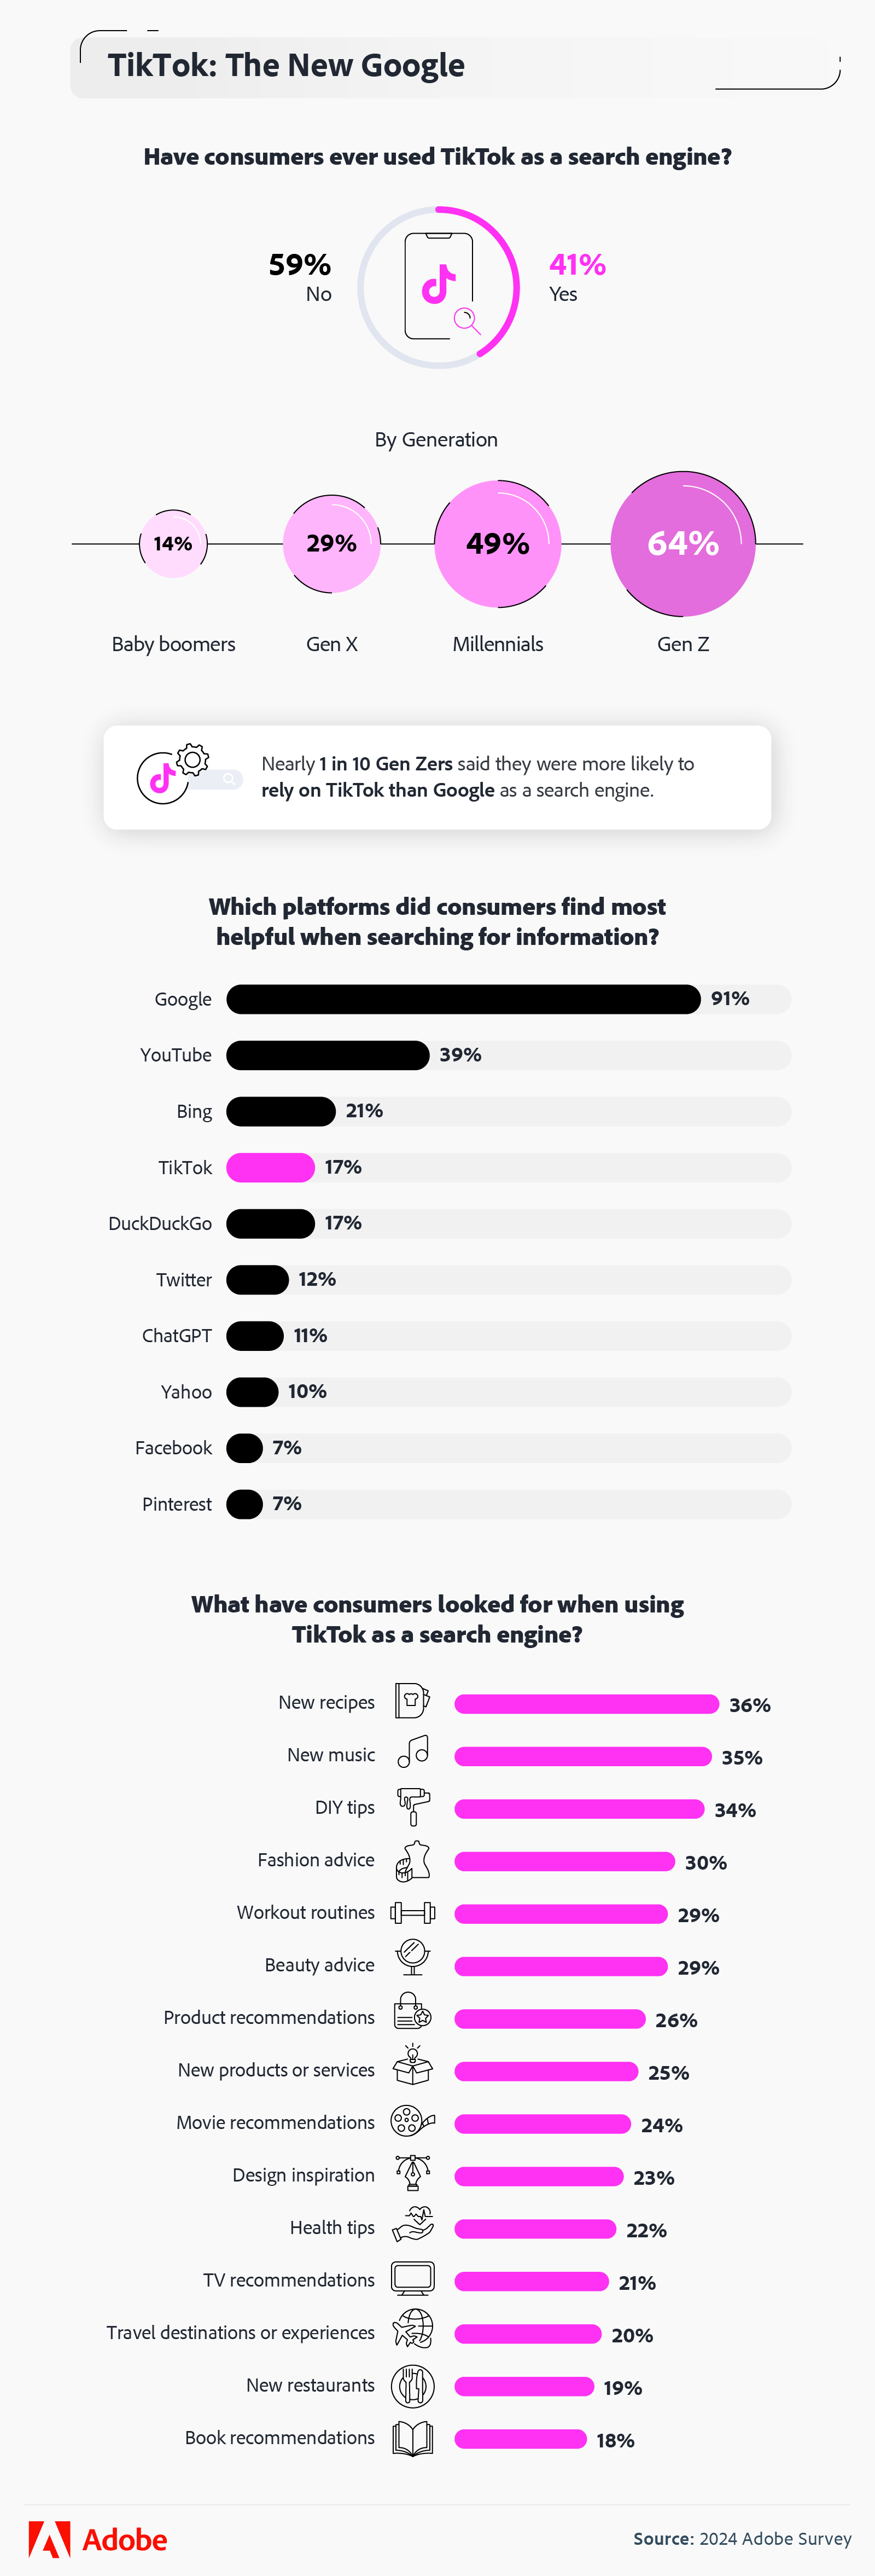
20 Mar 20242 in 5 Americans use TikTok as a search engine.
Nearly 1 in 10 Gen Zers are more likely to rely on TikTok than Google as a search engine.
More than half of business owners (54%) use TikTok to promote their business, posting an average of 9 times per month.
1 in 4 small business owners use TikTok influencers for product sales or promotions.

Source: Adobe
- Comments Off on TikTok’s search evolution
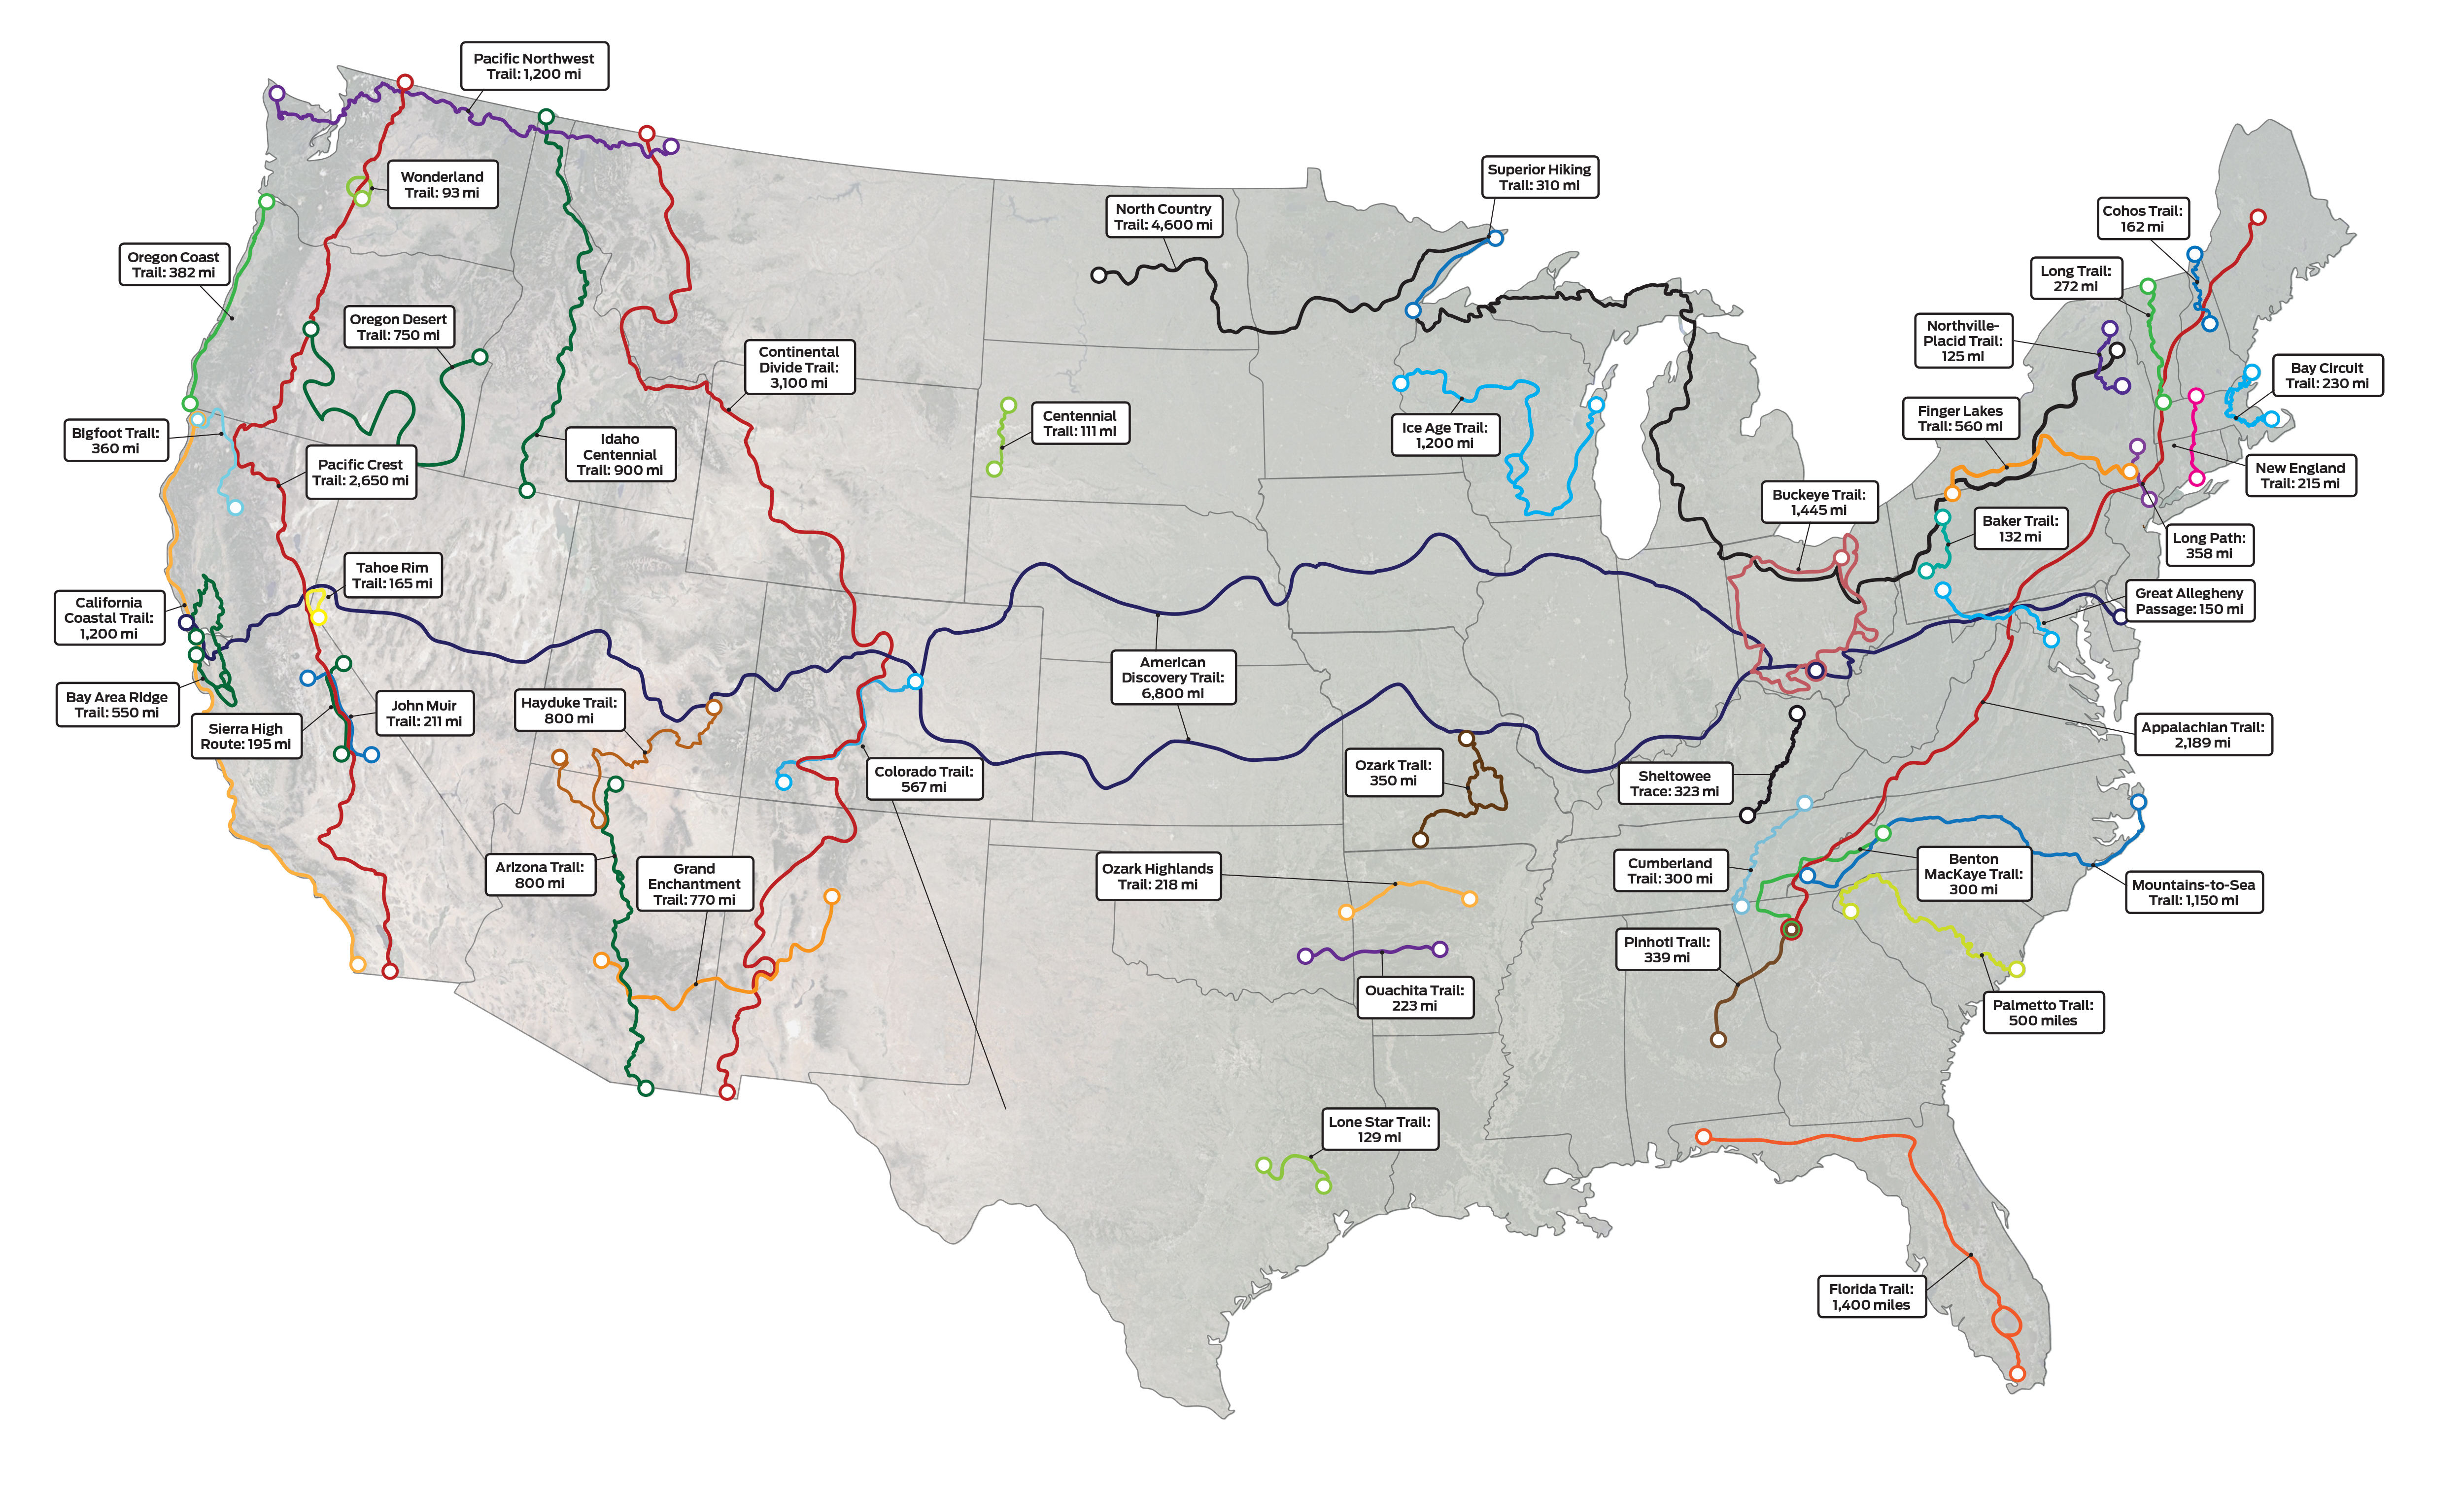
Long USA Hiking Trails
In: Maps
14 Jan 2020Chart Porn Hiatus
In: Uncategorized
5 Jan 2017I started this blog in 2008 as a simple personal repository of interesting data visualizations and graphic design resources. Watching it grow over the years has been a fascinating experience. I am sad to say that I am stepping away from day to day updates.
I have learned a lot, and met some amazing designers, programmers, and journalists – thank you for all your creativity and hard work. My career has shifted towards strategic planning and communications, but I will always have a place in my heart for a great chart, map, or interactive dashboard.
At it’s peak ChartPorn had more than 25,000 Twitter, Facebook, and RSS followers – and more than 300,000 monthly visitors. In the end we shared over 2,600 posts. I hope you found them inspiring.

Knowledge Management
In: Reference
22 Dec 20161921 Mid-atlantic Rail and Ferry Map
17 Nov 2016Stainless Steel City Maps
In: Maps
17 Nov 2016Post-election Analysis
17 Nov 2016Three very nice articles analyzing voting patterns:
Razor thin margins in important swing states:
What counties swung to the other party:
And an elegant but slightly hard to understand look at urban/rural differences:
2016 Election Info
2 Nov 2016I love how people will spend hours reading yelp to find the best tacos in town, searching for the cheapest flights for their next vacation, looking for costume accessories on etsy, comparing reviews of their next phone upgrade or amazon purchase, yet base their vote for leader of the free world on facebook rants and memes. The reviews are in. The information is available. Go read it. I will try to post some well designed site and tools to help below.
Vote411
Find personalized info on your voting locations, view down-ticket matchups, and any referendum items.
Ballotpedia
FiveThirtyEight
Want to know how the latest polls look? 538 has the most reliable analysis
Draw Your Own Electoral Map (CNN)
Try your own hand at allocating electoral votes.
Election Maps Lie
1 Nov 2016Well, actually all maps lie, in some ways or another. This is a nice article about what is wrong with election maps, and some weird maps that try to make them lie less.
Star Wars Fonts
4 Feb 2016The Fallen of World War II
4 Feb 2016I don’t think most people realize how many Russians died during WWII and how that defined the rest of the 20th century. The below videographic tells the entire WWII story in detail.
How You are Going to Die
4 Feb 2016A beautiful interactive chart of causes of death according to age. (via Washingtonpost)
The Evolution of Cell Phones
In: Culture Internet/tech
4 Feb 2016Language Families
17 Feb 2015A beautiful language tree by sssscomic.com.
What is Chart Porn?
An addictive collection of beautiful charts, graphs, maps, and interactive data visualization toys -- on topics from around the world.
Categories
- Bailout (118)
- Chartporn Related (3)
- Commentary (21)
- Culture (669)
- Emerging Markets (66)
- Employment (245)
- Environment/weather (133)
- Finance (298)
- Food (92)
- Global Economy (373)
- Graphic Design (bad) (26)
- Graphic Design (general) (183)
- Graphic Tools (23)
- History (158)
- Housing (162)
- Humor (204)
- Innovative (183)
- Interactive (545)
- Internet/tech (97)
- Maps (578)
- News Media (34)
- Politics (329)
- Reference (97)
- Science (331)
- Source: Economist (101)
- Source: FT (92)
- Source: NYT (147)
- Source: Ritholtz (76)
- Source: USA Today (27)
- Source: Washington Post (90)
- Source: WSJ (135)
- Sports (58)
- Stock Market (74)
- Uncategorized (2)
- Updated regularly (76)
- US Economy (553)
- Video (22)
- Aram Korevaar: This chart is now being used as a projection in which countries such as China see themselves as in a [...]
- David: Welcome back Chart Porn! [...]
- J S: Thanks for the great story. Miss reading this blog. Hope to see you more active again. [...]
- jake: I lived in a DC row house for 6 years, and I'm writing this comment from my tiny 1 bedroom apartment [...]
- ronny pettersen: Hilarious and unfortunately accurate... ;-) [...]


